Acura NSX (NC1)
Showing 193-216 of 268 listings

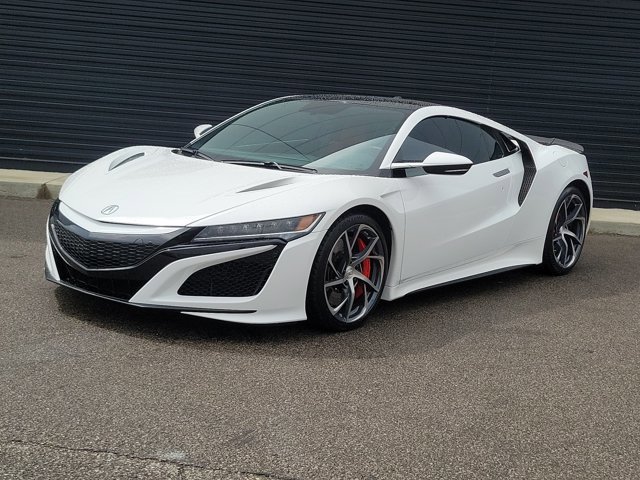
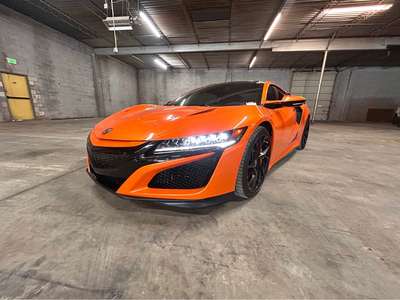
2019 Acura NSX
Cincinnati, OH
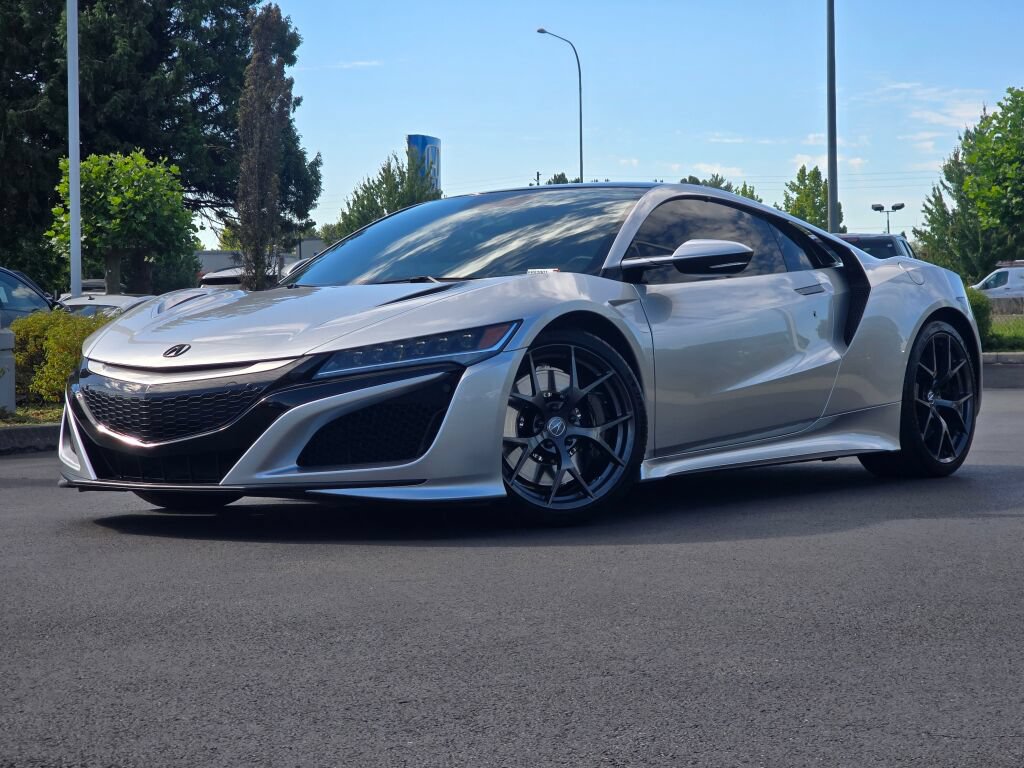
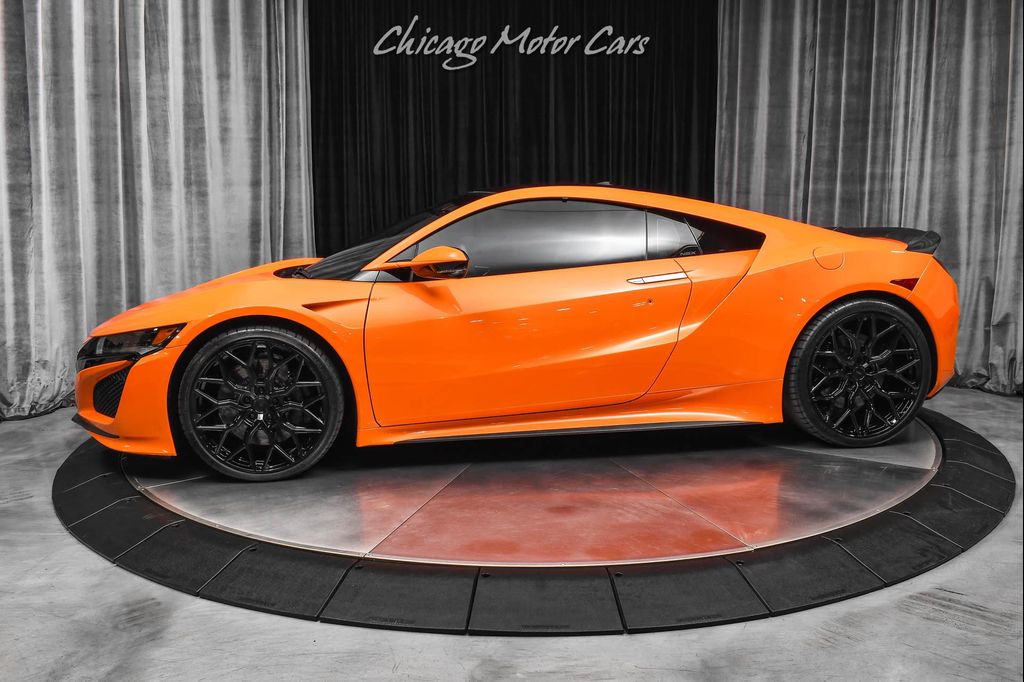
Used 2017 Acura NSX
Fife, WA
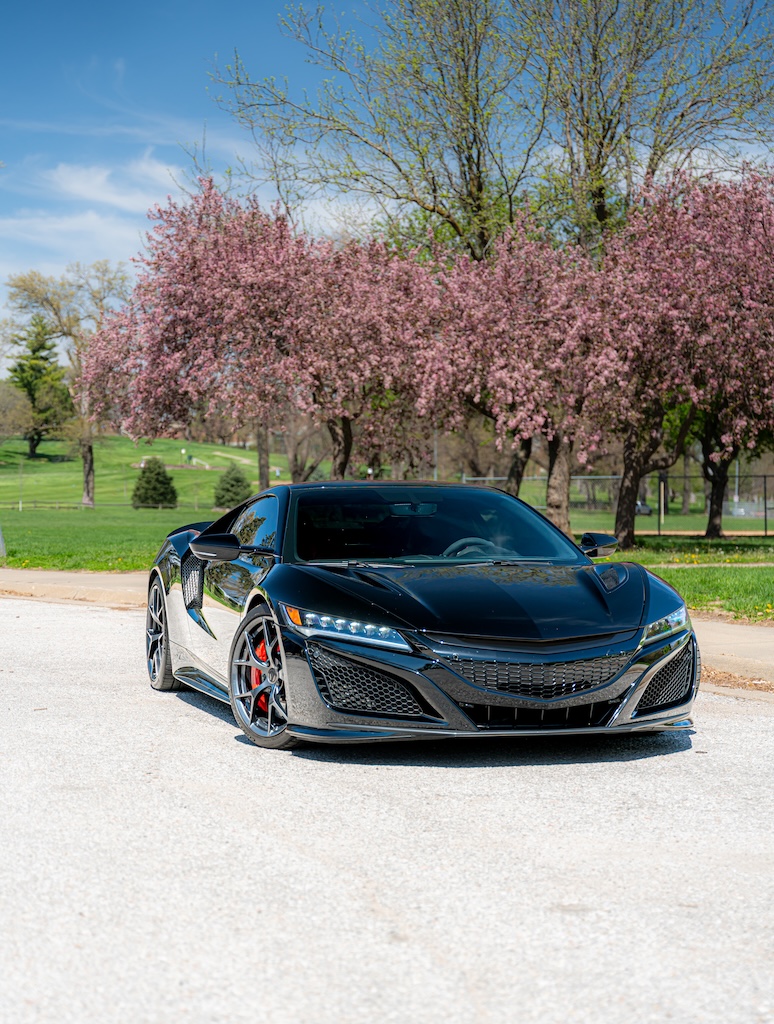
Used 2019 Acura NSX
Cincinnati, OH

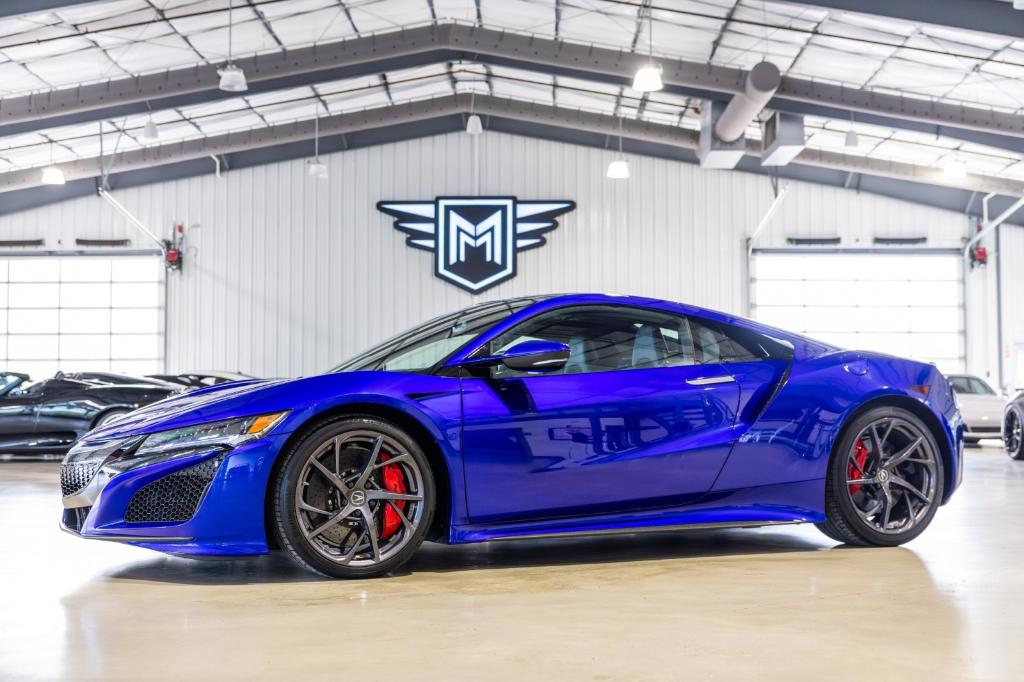
2017 Acura NSX
Pinellas Park, FL

2017 Acura NSX SH-AWD
Unknown

2019 Acura NSX SH-AWD
Cincinnati, OH
2019 Acura NSX - Coupe 2D
Boerne, TX
2020 Acura NSX
Dallas, TX

2017 Acura NSX
Unknown

2017 Acura NSX
Unknown

2017 Acura NSX
Unknown
2019 Acura NSX - Coupe 2D
Tulsa, OK
2019 Acura NSX
West Chicago, IL

2019 Acura NSX SH-AWD
Unknown

2017 Acura NSX SH-AWD
Ventura, CA

2019 Acura NSX
Rochester, MA
Used 2017 Acura NSX
Omaha, NE
2017 Acura NSX
Boerne, TX

2022 Acura NSX Type S SH-AWD
Las Vegas, NV

2017 Acura NSX SH-AWD
Boerne, TX
Used 2017 Acura NSX
Scottsdale, AZ

2019 Acura NSX
Unknown

2022 Acura NSX Type S
Unknown
2017 Acura NSX
Parker, CO
Acura NSX (NC1) Market Overview
Built by Acura from 2017-2022, the Acura NSX (NC1) is tracked across 268 active listings from 10 marketplaces including eBay Motors, Bring a Trailer, Cars & Bids, AutoTrader, CarGurus, Cars.com, and Facebook Marketplace. Each listing is analyzed by AI for quality, value, and condition.
Acura NSX (NC1) Pricing Data
As of July 2026, the median asking price for a Acura NSX (NC1) is $145,000, with an average of $173,367. The middle 50% of listings (25th to 75th percentile) are priced between $132,990 and $227,888. The median mileage across active listings is 12,745 miles. Listings spend an average of 78 days on market before selling or being removed.
Where to Find a Acura NSX (NC1)
The highest concentration of Acura NSX (NC1) listings by state: AZ (27), TX (24), FL (14), NV (9), OH (9). Listings are sourced from Classic.com (66), Cars.com (45), Facebook Marketplace (42), CarGurus (37), AutoTrader (32), eBay Motors (24).
Acura NSX (NC1) by Model Year
The most commonly listed model year is 2017 with 103 listings. Year breakdown: 2017 (103 listings), 2022 (66 listings), 2019 (35 listings), 2018 (22 listings), 2020 (21 listings).
Acura NSX (NC1) Sales History
CarSearch.Pro tracks 252 historical Acura NSX (NC1) sales from auction houses and dealer records. In 2026-Q3, the median sale price was $160,000 across 1 sales, down 18.8% from 2026-Q2 ($197,000).
| Quarter | Sales | Median Price | Average Price |
|---|---|---|---|
| 2025-Q2 | 18 | $193,250 | $183,186 |
| 2025-Q3 | 21 | $144,900 | $172,744 |
| 2025-Q4 | 33 | $139,995 | $157,451 |
| 2026-Q1 | 65 | $136,800 | $157,338 |
| 2026-Q2 | 11 | $197,000 | $180,434 |
| 2026-Q3 | 1 | $160,000 | $160,000 |