Fiat 500 (2012-2019)
Showing 865-888 of 1,418 listings
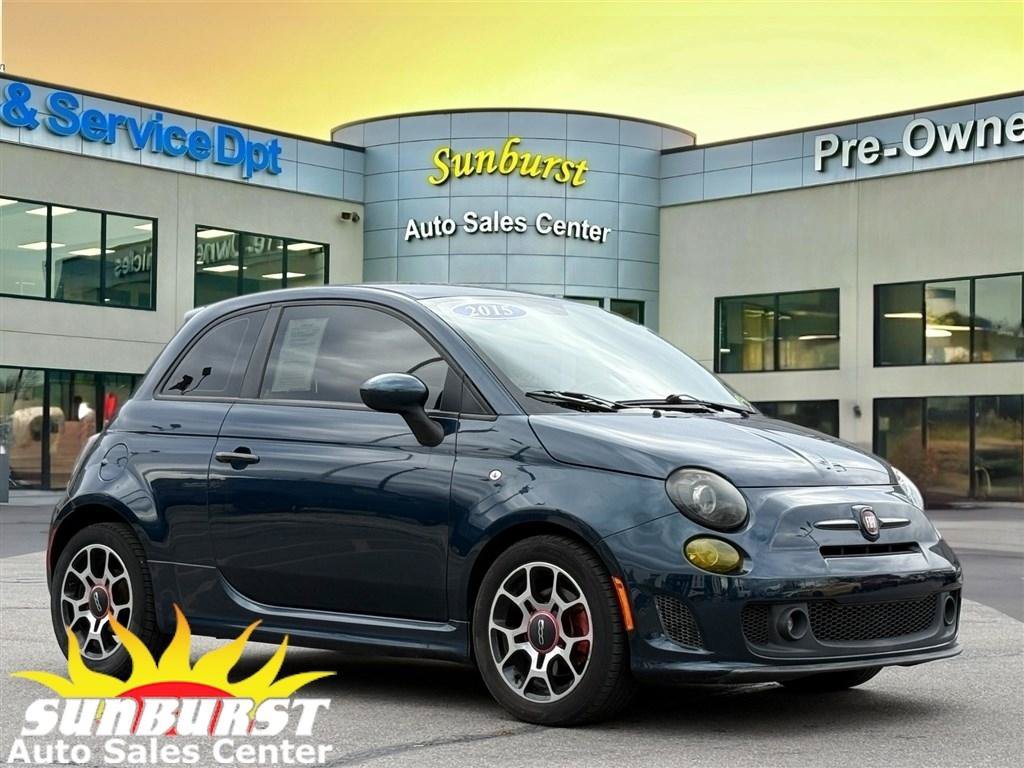
2015 Fiat 500 - Pop Hatchback 2D
Houston, TX
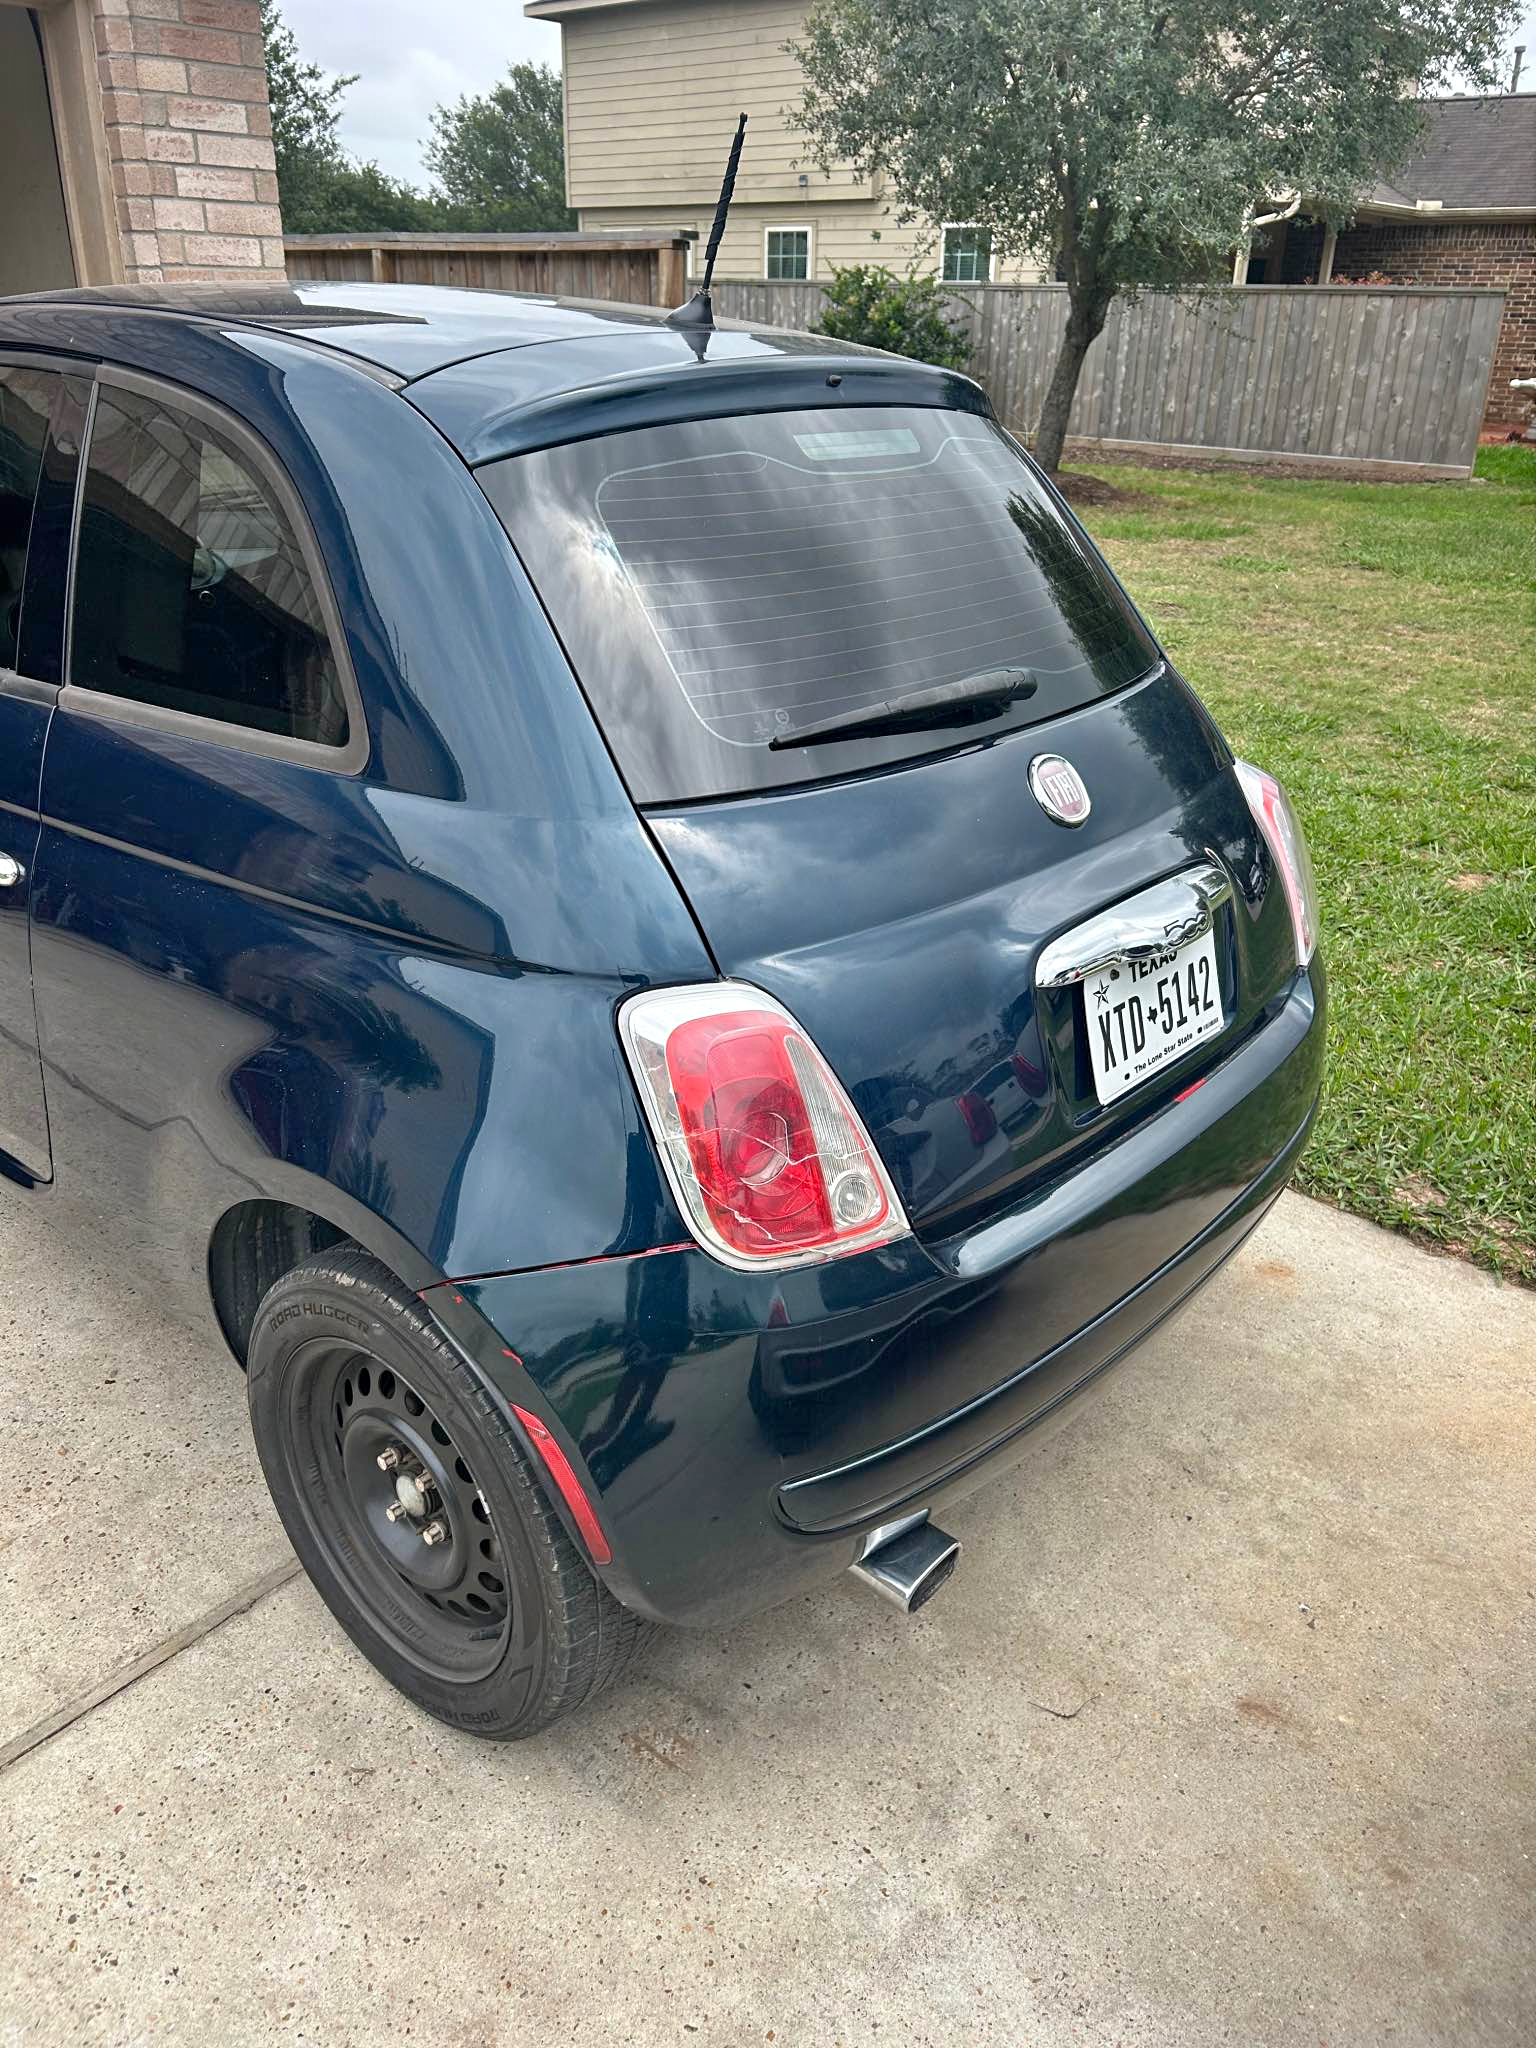
2012 Fiat 500 - Sport Hatchback 2D
Houston, TX

2013 FIAT 500 Pop
Tampa, FL

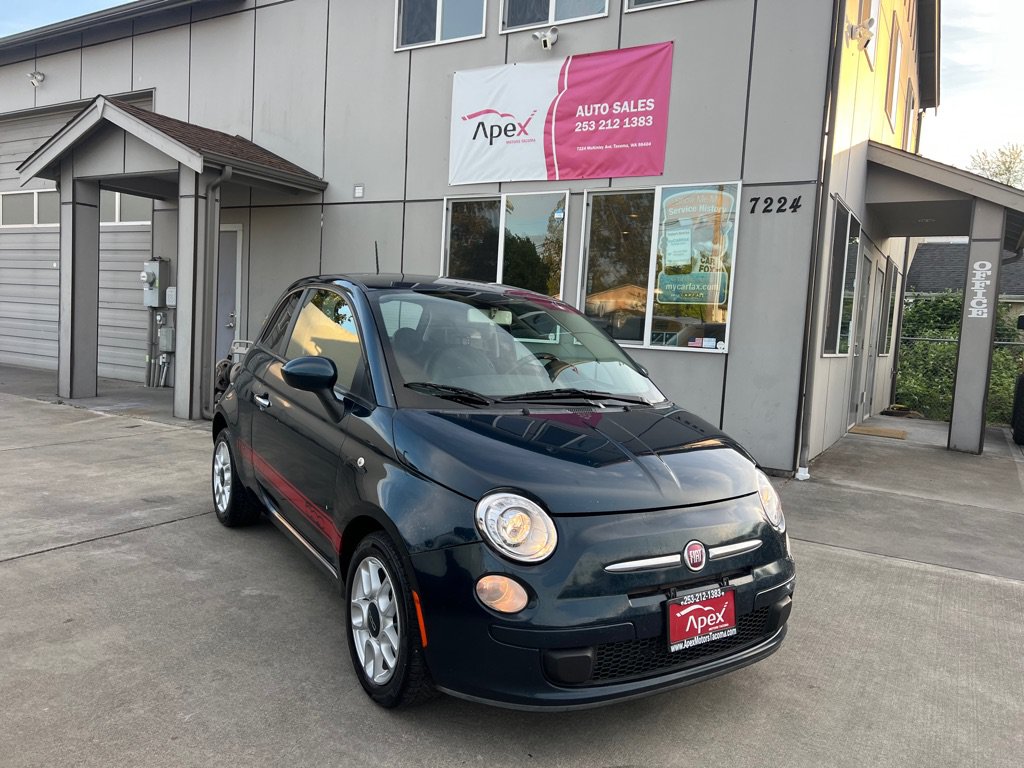
2013 FIAT 500 Pop
Tacoma, WA

2018 FIAT 500 Pop Hatchback FWD
Greensboro, NC

2015 FIAT 500 Lounge
Chantilly, VA
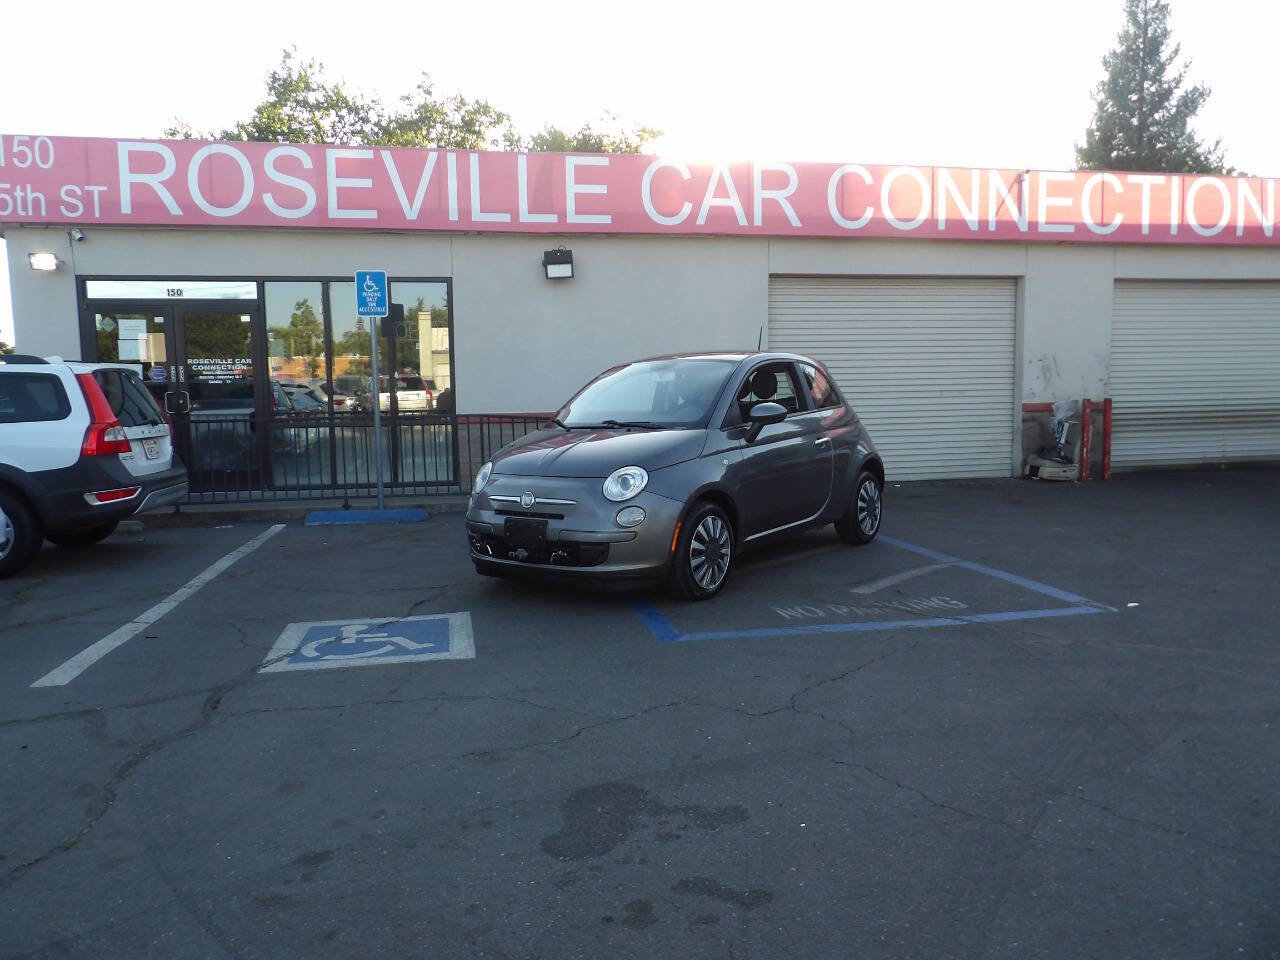
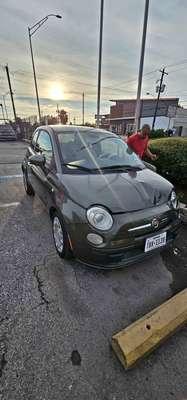
Used 2013 FIAT 500 Pop
Roseville, CA

2015 FIAT 500 Turbo
Salt Lake City, UT

2013 FIAT 500
Kansas City, KS
2019 FIAT 500
Chantilly, VA
2013 FIAT 500
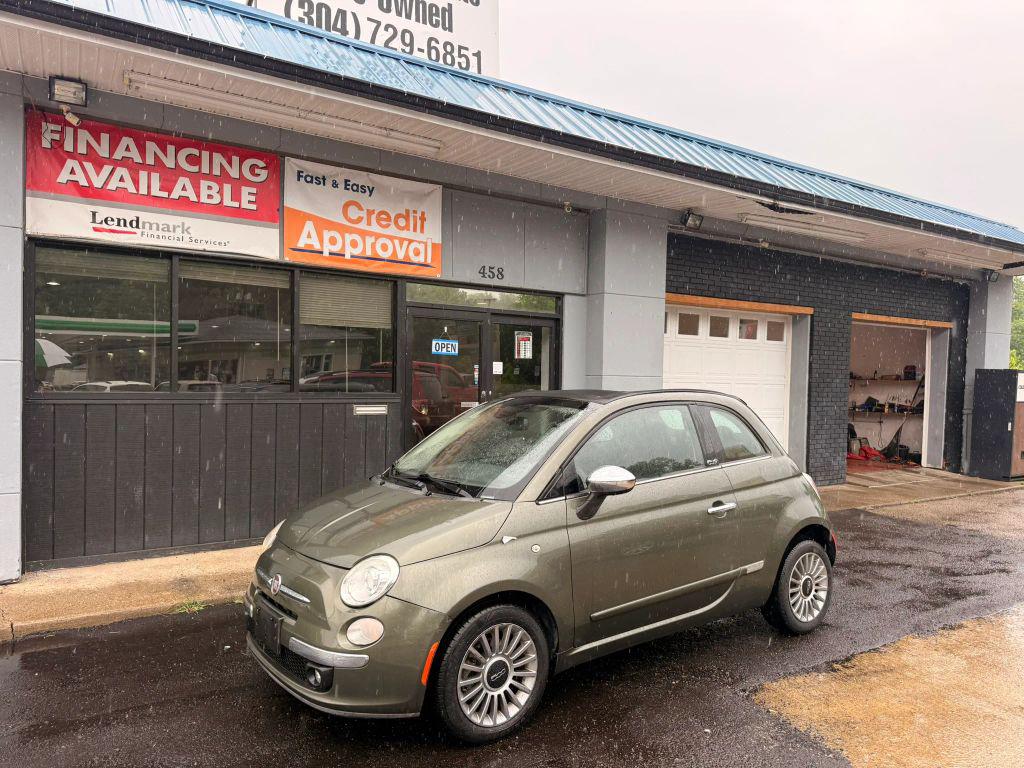
Marmet, WV

2013 FIAT 500 Lounge
Houston, TX
Used 2015 FIAT 500 Lounge w/ Luxury Leather Package
Chantilly, VA
Used 2013 FIAT 500 Pop
Tempe, AZ

2017 FIAT 500 Pop Hatchback FWD
Mesa, AZ

2015 FIAT 500 Sport
Paterson, NJ
2015 FIAT 500
FREDERICKSBURG, Virginia

2012 FIAT 500 Pop
Brodheadsville, PA
Used 2015 FIAT 500 Turbo
Salt Lake City, UT
Used 2013 FIAT 500 Pop
Tacoma, WA
Used 2012 FIAT 500 Pop
Uniontown, PA

2013 FIAT 500
Las Vegas, NV
2015 Fiat 500 - 500C Gucci Convertible 2D
Hawthorne, CA
2012 Fiat 500
Chicago, IL
Fiat 500 (2012-2019) Market Overview
Built by Fiat from 2012-2019, the Fiat 500 (2012-2019) is tracked across 1,418 active listings from 7 marketplaces including eBay Motors, Bring a Trailer, Cars & Bids, AutoTrader, CarGurus, Cars.com, and Facebook Marketplace. Each listing is analyzed by AI for quality, value, and condition.
Fiat 500 (2012-2019) Pricing Data
As of July 2026, the median asking price for a Fiat 500 (2012-2019) is $5,500, with an average of $5,462. The middle 50% of listings (25th to 75th percentile) are priced between $4,000 and $6,777. The median mileage across active listings is 96,000 miles. Listings spend an average of 102 days on market before selling or being removed.
Where to Find a Fiat 500 (2012-2019)
The highest concentration of Fiat 500 (2012-2019) listings by state: CA (158), FL (110), TX (83), WA (66), NJ (55). Listings are sourced from CarGurus (289), Facebook Marketplace (277), AutoTrader (236), Cars.com (138), Classic.com (41), eBay Motors (13).
Fiat 500 (2012-2019) by Model Year
The most commonly listed model year is 2012 with 355 listings. Year breakdown: 2012 (355 listings), 2013 (271 listings), 2015 (213 listings), 2014 (73 listings), 2017 (39 listings).
Fiat 500 (2012-2019) Sales History
CarSearch.Pro tracks 108 historical Fiat 500 (2012-2019) sales from auction houses and dealer records. In 2026-Q2, the median sale price was $3,850 across 7 sales, down 50.3% from 2026-Q1 ($7,750).
| Quarter | Sales | Median Price | Average Price |
|---|---|---|---|
| 2025-Q1 | 6 | $11,000 | $14,533 |
| 2025-Q2 | 5 | $5,619 | $7,532 |
| 2025-Q3 | 6 | $17,000 | $15,267 |
| 2025-Q4 | 4 | $5,995 | $4,623 |
| 2026-Q1 | 9 | $7,750 | $7,812 |
| 2026-Q2 | 7 | $3,850 | $5,756 |